Cardiac remodeling and global longitudinal strain in young male competitive athletes: A comparative study across different training modes
ORIGINAL RESEARCH ARTICLE
Cardiac remodeling and global longitudinal strain in young male competitive athletes: A comparative study across different training modes
Article Summary
- DOI: 10.24969/hvt.2024.543
- CARDIOVASCULAR DISEASES
- Published: 03/02/2025
- Received: 11/11/2024
- Revised: 15/12/2024
- Accepted: 09/01/2025
- Views: 6980
- Downloads: 3068
- Keywords: Young elite athletes, weekly training time, total training time, athletic heart, global longitudinal strain
Address for Correspondence: Damirbek A.Abibillaev, Department of Therapeutic Disciplines and Family Medicine, Faculty of Medicine, Ala-Too International University, Bishkek, Kyrgyzstan
E-mail: damirbek.abaibillaev@anadolu.edu.kg
ORCID: Damirbek A.Abibillaev - ORCID 0000-0002-4660-3064; Aida K.Baatyrbekova - ORCID 0000-0002-1694-567X); Aisanam K. Abdurasulova - ORCID 0000-0002-4728-4026; Kudaibergen R. Osmonaliev - ORCID 0009-0008-4469-1065; Ryskul B.Kydyralieva - ORCID 0000-0003-4959-1449; Taalaibek Z.Kudaiberdiev - ORCID 0000-0002-3669-066X;
Damirbek A.Abibillaev1a,2a,3*, Fuat Kocyigit4, Aida K.Baatyrbekova2a,2b, Aisanam K. Abdurasulova1a, Kudaibergen R. Osmonaliev1b, Samatbek A. Satybaldyev2a, Zhenishbek K. Ismailov2a, Ryskul B.Kydyralieva1a, Oskon A.Salibaev2a, Taalaibek Z.Kudaiberdiev5
1aDepartment of Therapeutic Disciplines and Family Medicine and 1bDepartment of Surgical Disciplines and Obstetrics&Gynecology, Faculty of Medicine, Ala-Too International University, Bishkek, Kyrgyzstan
2aMedical Center of I.K.Akhunbaev Kyrgyz State Medical Academy, Consultative and Diagnostic Department and 2bDepartment of Faculty Therapy, I.K.Akhunbaev Kyrgyz State Medical Academy Bishkek, Kyrgyzstan
3Consultative and Diagnostic Department, Scientific Research Institute of Heart Surgery and Organ Transplantation, Bishkek, Kyrgyzstan
4International School of Medicine, International University of Kyrgyzstan, Research Department, Bishkek, Kyrgyzstan,
5Heart, Vessels and Transplantation, Center for Scientific Research and Development of Education, Bishkek, Kyrgyzstan
Abstract
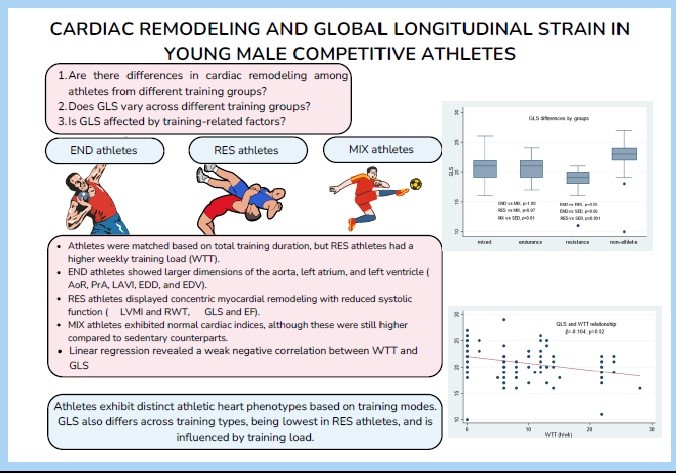
Objective: Athletic heart (AH) is the structural, and functional cardiac alterations depending on a training type, intensity and number of sports-related factors (SRF) in an athletic cohort. Global longitudinal strain (GLS) is the earlier marker of cardiac dysfunction and predicts adverse outcomes. In this study, we aimed to determine the phenotypes of AH in the athletes of different training types (TT) and relationship between the SRF and the GLS.
Methods: In this cross-sectional study, 58 young competitive male athletes (aged 14-22) undergoing endurance (END) (n=15), resistance (RES) - 22, and mixed (MIX) - 21 trainings and 29 sedentary subjects (SED) were enrolled. We obtained total training time (TTT, months), weekly training load (WTL, hrs/week), and tournament participation for each athlete. Using transthoracic echocardiography (TTE) we evaluated all standard aortic dimensions, left heart chamber quantifications, left ventricular mass index (LVMI) and GLS. For statistical analysis we used the ANOVA/Kruskal-Wallis tests, and Chi-square/Fischer’s exact tests and multiple linear regression analysis (MLA).
Results: Athletes were matched by TTT, where the overall median was 42 (24-72) months (p=0.31), but WTL significantly differed with median values of 12 (8-22) h/wk (p≤0.001). Noteworthy, RES athletes exhibited the highest WTL (22 (22-22) h/wk. Aortic dimensions and left cardiac chamber quantifications differed between groups (p<0.05). The END athletes exhibited higher aortic diameters, left atrial volume and left ventricular end-diastolic volume (p<0.05). The RES athletes showed the highest wall thickness and left ventricular mass (p≤0.001). Athletes of the MIX group showed modest changes in cardiac structural indices, however, still, these values were higher than in SED matches (p<0.05). Mean LVMI was 73.1 (17.1) g/m2 with substantial variations among groups (p<0.001). Concentric remodeling was predominantly seen in the RES athletes. Median GLS was – 21 (-19, -22)% and significantly differed between groups (p<0.001). MLR revealed the negative significant relation between WTL and GLS (unadjusted β=-0.16, adjusted β =-0.12, p=0.01, 95% CI =-0.212, -0.029), while age, TTT, LVMI did not affect GLS (p˃0.05).
Conclusion: Our study emphasizes the diverse phenotypes of AH in the competitive athletes of different TT. The RES athletes have decreased GLS and thickened myocardium in contrast to other athletic groups and SED matches. Furthermore, higher WTL significantly decreases the GLS in athletes and may be a predictor of adverse outcomes in athletes.
Key words: Young elite athletes, weekly training time, total training time, athletic heart, global longitudinal strain;
Graphical abstract
Introduction
The heart undergoes several adaptations in response to regular physical activity, which can differ according to the nature of the sport. This phenomenon, known as the "athlete's heart" (AH), encompasses structural and functional cardiac remodeling by training type, including endurance (END), resistance (RES), and mixed (MIX) training (1, 2). Dynamic and static components of physical activity significantly influence the phenotypes and the magnitude of athletic cardiac remodeling as well (2, 3). Athletes engaged in exaggerated physical activity often exhibit larger cardiac chambers, thickened myocardium, and enhanced systolic function compared to non-athletic individuals (3, 4).
These cardiac adaptations, while generally considered physiological, can sometimes overlap with pathological conditions, raising the importance of detailed cardiovascular evaluation. The use of both echocardiography and electrocardiography (ECG) is central to this assessment, as they offer non-invasive methods to evaluate heart structures, function, and electrical activity (1, 4, 5). Per se, the AH is characterized by symmetrical hypertrophy with concomitant dilatation of chambers of predominantly left side of the heart (1, 5, 6). However, it is critical to distinguish these physiological features from maladaptive hypertrophy, which may arise in response to excessive and inappropriate training loads, leading to a disproportionate increase in wall thickness without corresponding chamber dilation, and potential impairment of cardiac function and predominantly seen in the right heart chambers (6-8).
Speckle-tracking echocardiography with a global longitudinal strain (GLS) modality, offers the sensitive assessment of myocardial deformation, allowing for the early detection of subclinical ventricular dysfunction (9, 10).
As a rule, elite athletes exhibit supernormal values of GLS as per conventional ejection fraction. Moreover, regular exercise was found to be a strong protective power from the burden of cardiovascular diseases by large-scale studies (9). As GLS is a novel and reliable marker of cardiac dysfunction, it can be decreased in athletes with undiagnosed inherited cardiomyopathies (10). Furthermore, deformation imaging can help identify the earlier signs of maladaptive hypertrophy that predispose athletes to complications such as arrhythmias or heart failure (9, 11).
The goal of this study is to investigate the cardiac structural indices and deformation parameters, using echocardiography and strain imaging, in young competitive athletes engaged in different types of sportive training, compared to sedentary controls. We hypothesize that these athletes will exhibit different patterns of cardiac remodeling, potentially influenced by sports-related factors (SRF) such as the total training time (TTT), weekly training load (WTL), and participation in competitions. Furthermore, we assume that above-mentioned SRF related to maladaptive cardiac remodeling might be involved in the GLS alterations.
Methods
Study Design and Ethics
Our cross-sectional study included 63 athletes from three different training type groups and 29 sedentary (SED) matches: END training (swimmers and athletics), RES training (Greco-Roman and freestyle wrestlers), and MIX training athletes (football players) from the Republican College of Olympic Reserve and Kyrgyz State Academy of Sports and Physical Culture in Bishkek, Kyrgyz Republic during the September to November of 2022.
The participants were selected according to convenient sampling and were divided into four groups based on their training type: END, RES and (MIX) training groups and SED control. Inclusion criteria for the study were male individuals aged between 14 and 20 years, with at least 6 months of regular training with a minimum of 3 training sessions per week (for athletic participants), and lack of prior history of cardiovascular disease or other chronic medical conditions.
The study was approved by the Institutional Review Board (IRB) of the Ala-Too International University by the Declaration of Helsinki. All participants provided informed consent before participating in the study. Data was collected anonymously and stored securely to ensure confidentiality.
Baseline variables
All athletes were evaluated for baseline clinical examinations and electrocardiography, and the following demographic, anthropometric and clinical indices, such as age, body weight, height and body surface area (BSA) (calculated according to Mosteller formula), pre=procedure systolic (SBP, mmHg), and diastolic blood (DBP, mmHG) pressures, heart rate (HR, beats/min), were recorded.
Sports-related variables
SRF included the training type and sportive disciplines, total training time (TTT) expressed in months, weekly training load (WTL) expressed in hours per week (h/wk), and the number of participated competitions (NPC) regardless of the level of the tournament (local, republic, international).
Echocardiographic assessment
All athletes underwent a comprehensive transthoracic echocardiographic (TTE) evaluation using a standardized protocol recommended by EACVI guidelines (12). Echocardiograms were performed by a single experienced cardiologist from the Scientific Research Institute of Heart Surgery and Organ Transplantation to ensure consistency in measurements. A Philips CX50 scanner with both adult and pediatric phased-array probes was used for the examination.
The following morphological echocardiographic parameters of left heart were evaluated: left ventricular end-diastolic diameter (LVEDD), left ventricular end-systolic diameter (LVESD), left ventricular end-diastolic volume (LVEDV), left ventricular end-systolic volume (LVESV), left ventricular ejection fraction (LVEF), diastolic interventricular septum thickness (IVS), diastolic left ventricular posterior wall thickness (LVPW), left ventricular mass index (LVMI), relative wall thickness (RWT), left atrial anteroposterior diameter (LAD) and volume index LAVI), and aortic diameters at the levels of aortic valve annulus (AVA), sinuses of Valsalva (SV), sinotubular junction (STJ), and proximal ascending aorta (PAA). All measurements and reference values were instructed under existing guidelines (9, 12).
Furthermore, left ventricular GLS was evaluated offline by a single experienced operator. The QLAB-based 17-segment model of analysis was applied for offline GLS calculations. The GLS values were calculated and interpreted following current guidelines (11, 13).
Statistical analysis
All analyses were performed using Stata 16.1 software (StataCorp, Texas, USA).
Descriptive statistical calculations were performed for all variables, with continuous variables reported as the mean and standard deviation (SD) in case of normal distribution noted and categorical variables as absolute count and percentages: n (%). When the normality of distribution was violated, the median and interquartile range (Q1, Q3) were applied for continuous variables. The normality of distribution was evaluated by the group-adjusted Shapiro-Wilk test. In the case of the normal distribution, the Levene test was applied for variance homogeneity assessment.
Differences in cardiac morphology and function between the training groups an controls were assessed by using one-way analysis of variance (ANOVA) or Kruskal-Wallis tests, depending on the data distribution. Post-hoc Sidak and Dunn’s tests with Bonferroni correction were applied for the pairwise comparison analysis. Multiple linear regression was applied to determine the relationship between GLS and other parameters. Parameters found with significant results in simple linear regression were included in the model. The accuracy of the model was assessed according to the results of the overall model F-test, linktest, and Breusch-Pagan test for heteroskedasticity. A p-value < 0.05 and 95% confidence intervals (CI) were adjusted for statistical significance.
Results
Demographic, anthropometric, and sports-related findings
Due to deconditioning, two track and field athletes were excluded from the study. Three more athletes (two swimmers and one freestyle wrestler) were excluded from the study due to age eligibility criteria (10 years old). The overall sample structure according to the sports disciplines presented as follows: nine track and field athletes, six swimmers, twenty-two wrestlers, and twenty-one footballers. According to training categorizations, of 87 participants 15 athletes belong to the END, 22 to the RES, and 21 to the MIX groups matched to 29 controls in the SED group. Participant selection was achieved by STROBE guidelines (Fig. 1).
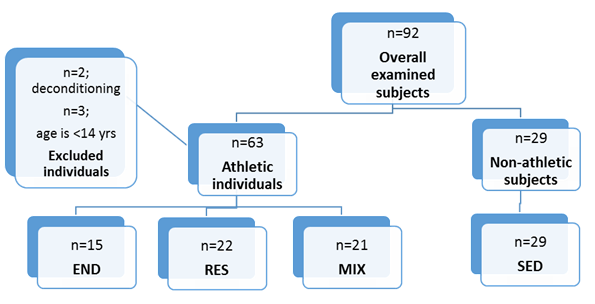
Figure 1. STROBE-flowchart of participant selection
Baseline characteristics (Tables 1, 2)
The median age of athletes was 16 (IQR 15-18) years with significant differences (overall p=0.01) across grpups. Similarly, weight, height, and BSA exhibited statistical differences by groups (overall p=0.009, 0.009, 0.01, respectively). According to comparison analysis, the MIX athletes were found to be younger and smaller in stature compared to other groups. The average pre-procedure SBP and DBP values were 107.4 (10.05) mmHg and 70 (IQR 65–75) mmHg, respectively, with wrestlers showing higher blood pressure levels compared to other athletes and sedentary controls (p=0.005 and 0.003, respectively for SBP and DBP). Resting heart rate was also registered to be lower in the RES (60 (IQR 53-68) bpm, p=0.008) with an overall median of 65.5 (IQR 57-75) bpm. Thus, the RES group was presented with remarkable hemodynamic characteristics, followed by the END and the MIX groups.
Sports-related factors (Tables 1, 2)
SRF demonstrated the following results: median level of the TTT was 42 (IQR 24-72) months, and considered as comparable between athletic groups (p=0.31). The WTL, significantly differed by groups (overall median 8(IQR 0-14), p<0.001), with the RES athletes showing the highest WTL and the MIX athletes presenting the least. The average NPC was also comparable by groups, with an overall median of 2 (1-3) times of participation (p=0.23). END athletes most frequently participated in tournaments, followed by wrestlers and football players. Overall, fifty-one of the athletes participated in at least one of the tournaments, and athletic groups did not show a statistical difference (p=0.10).
Comparison of echocardiographic left heart indices according to the training type (Tables 1, 2)
Echocardiographic aortic diameters revealed significant differences by comparison analysis (p<0.05). The AVA showed differences between the END and the MIX groups (post-hoc p=0.01). However, it did not differ between endurance and resistance groups (post-hoc p=1.00) and between the MIX and the SED (post-hoc p=0.27). The END group exhibited the highest diameters of the SV, STJ, and PAA among all study groups. Nonetheless, post-hoc comparison between the END and the RES groups did not reveal significant differences (post-hoc p=1.00 for SV; post-hoc p=0.66 for STJ; post-hoc p=0.17 for PAA). In the MIX group, SV values were identical to the values of control groups (post-hoc p=0.69) unlikely that STJ and PAA revealed substantial differences with control subjects (post-hoc p<0.001 for both values).
Antero-posterior left atrial size demonstrated higher values in athletes than in SED controls (p<0.001), although pairwise comparisons of athletic groups did not indicate substantial differences (p˃0.05). The LAVI was significantly larger in athletes than in control subjects but did not differ between the athletic groups (p˃0.05). The left ventricular dimensions, namely EDD and ESD did not present statistical differences in an overall comparison analysis (overall p=0.11 and 0.71, respectively). However, volumetric indices of the left ventricle revealed significant differences between the groups. The EDV was found to be the largest in the END group and the smallest in the SED matches (overall p≤0.001). However, ESV was highest in the RES with statistical differences between groups (overall p=0.004). The intragroup comparison revealed the significant difference between wrestlers and footballers (post-hoc p=0.009), as well as between wrestlers and control groups (post-hoc p=0.01).
The IVS was reported with the highest values in the RES group, followed by the END group, where the MIX group and non-athletes exhibited lower results (overall p<0.001). Posterior wall thickness was also found with identical results (overall p>0.001). Furthermore, these differences were confirmed by the comparison results of the LVMI (overall p≤0.001) and RWT (overall p≤0.001) values. Group comparison results of LVMI IS also depicted in Figure 2. Left ventricular geometrical alteration was found overall in 13 cases and presented by concentric remodeling. Intergroup analysis revealed that remodeling predominated in the RES group (n=7) and equal amounts (n=2) in other groups (p=0.07).
Median values EF and GLS were found within reference ranges (59.1 (IQR 55, 63.2)% and -21 (IQR -19, -22)%, respectively) with significant differences between groups (overall p<0.001 for both EF and GLS). Interestingly, the RES athletes exhibited the lowest GLS values among the study groups with further confirmation of post-hoc analyses (RES vs. END, p=0.05; RES vs. MIX, p=0.07, RES vs. SED, p<0.001, demonstrated in Fig. 3).
|
Table 1. Comparative analysis of groups revealed the significant (p<0.05) differences among groups |
|||||||
|
Variables |
Total (n=87) |
END (n=15) |
RES (n=22) |
MIX (n=21) |
SED (n=29) |
H/F value |
p |
|
Age, years# |
16 (15-18) |
17 (15-19) |
16 (15-19) |
14 (14-16) |
17 (16-17) |
12.68 |
0.01 |
|
Weight, kg# |
60 (51-66) |
57 (52-67) |
63 (51-70) |
52 (47-59) |
62 (59-66) |
10.95 |
0.009 |
|
Height, m# |
168 (163-174) |
172 (169-177) |
165 (160-176) |
165 (160-170) |
169 (167-173) |
12.93 |
0.009 |
|
BSA, kg/m2# |
1.68 (1.57- 1.78) |
1.65 (1.58- 1.83) |
1.68 (1.55- 1.91) |
1.59 (1.43- 1.65) |
1.72 (1.68- 1.77) |
10.75 |
0.01 |
|
SBP, mmHG* |
107.2 (10.05) |
106.05 (10.5) |
112.6 (10.9) |
108.09 (8.13) |
102.93 (8.5) |
5.03 |
0.005 |
|
DBP, mmHG# |
70 (65-75) |
70 (60-75) |
80 (70-80) |
70 (65-70) |
70 (60-70) |
13.25 |
0.003 |
|
HR, beats/min# |
65.5 (57-75) |
63 (55-70) |
60 (53-68) |
71 (68-77) |
66 (60-75) |
13.79 |
0.008 |
|
TTT, months#! |
42 (24-72) |
48 (24-72) |
36 (24-60) |
24 (12-60) |
NA |
2.38 |
0.31 |
|
WTL, hrs/week#! |
12 (8-22) |
12 (8-13.5) |
22 (22-22) |
6 (6-8) |
NA |
46.54 |
<0.001 |
|
NPC, n#! |
2 (1-3) |
3 (1-10) |
2 (1-3) |
2 (2-2) |
NA |
46.58 |
0.23 |
|
NPCA, n(%)! |
51 (87.9) |
15 (100) |
17 (77.2) |
19 (90.5) |
NA |
|
0.10 |
|
AVA, mm* |
19.92 (2.12) |
20.34 (2.00) |
20.73 (1.88) |
18.76 (2.15) |
19.94 (2.07) |
9.43 |
0.01 |
|
SV, mm* |
27.73 (3.01) |
29.36 (3.87) |
28.90 (2.63) |
27.35 (2.83) |
26.27 (2.15) |
15.08 |
<0.001 |
|
STJ, mm* |
23.37 (3.24) |
25.97 (3.40) |
24.32 (2.57) |
24.51 (2.24) |
20.48 (1.99) |
38.98 |
<0.001 |
|
PAA, mm* |
22.97 (3.08) |
25.78 (3.27) |
23.45 (2.63) |
23.68 (2.32) |
20.64 (2.08) |
31.05 |
<0.001 |
|
LA, mm* |
30.40 (3.93) |
33.05 (3.55) |
31.75 (3.32) |
30.92 (2.34) |
27.64 (3.95) |
10.7 |
<0.001 |
|
LAVI, ml/m2# |
19.9 (14.9- 26.4) |
26.6 (22.8-33.0) |
21.7 (16.3- 25.6) |
23.07 (22.07- 29.3) |
14.2 (12.7-17.6) |
37.3 |
<0.001 |
|
LVEDD, mm* |
47.13 (4.20) |
49.37 (4.48) |
46.57 (4.62) |
47.32 (2.82) |
46.25 (4.31) |
2.06 |
0.11 |
|
LVESD, mm# |
31.0 (28.5-33.1) |
32.2 (27.6- 33.6) |
31.0 (30-34) |
30.9 (27.5- 32.2) |
30.9 (28.9- 32.3) |
1.34 |
0.71 |
|
IVS, mm# |
8.1 (7- 9) |
8.3 (8.1-8.9) |
9.2 (9-10) |
7.5 (7-8.1) |
7.2 (6.8-8.1) |
34.06 |
<0.001 |
|
LVPW, mm* |
8.2 (1.38) |
8.6 (0.79) |
9.3 (1.04) |
7.6 (1.20) |
7.5 (1.36) |
12.7 |
<0.001 |
|
LVMI, g/m2 * |
73.17 (17.10) |
81.53 (8.80) |
86.5 (15.06) |
69.19 (15.25) |
61.62 (14.01) |
15.8 |
<0.001 |
|
RWT# |
0.34 (0.3-0.39) |
0.33 (0.31-0.35) |
0.40 (0.36- 0.44) |
0.32 (0.3- 0.36) |
0.33 (0.3-0.35) |
24.9 |
<0.001 |
|
LVGa, n(%) |
13 (14.9) |
2 (13.3) |
7 (31.8) |
2 (9.5) |
2 (6.9) |
0 |
0.07 |
|
EDV, ml# |
8 (50.1- 97.0) |
95.4 (85.5-110.0) |
94 (86-114) |
81.2 (74.4-90.0) |
47.3 (44.6-50.3) |
39.02 |
<0.001 |
|
ESV, ml# |
33.3 (29-41.9) |
39.5 (32.4-44.6) |
40.5 (31-48.4) |
29.6 (26.6- 36.5) |
31.4 (28.9- 33.9) |
13.2 |
0.004 |
|
EF, %# |
59.1 (55-63.2) |
60.4 (58.6-64.4) |
58.5 (55-62) |
63.2 (60.4-64.2) |
56 (52.6-59.9) |
17.8 |
<0.001 |
|
GLS, %# |
-21 (-19,-22) |
-21 (-19,-22) |
-19 (-18,-20) |
-21 (-19, -22) |
-23 (-22, -24) |
28.7 |
<0.001 |
|
AVA – aortic valve annulus, BSA – body surface area, DBP – diastolic blood pressure, EDV – end-diastolic volume, ESV – end-systolic volume, GLS – global longitudinal strain, HR – heart rate, hours - hrs, IVS – interventricular septum, PAA – proximal ascending aorta, LA – left atrium, LAVI – left atrial volume index, LVEDD – left ventricular end-diastolic diameter, LVESD – left ventricular end-systolic diameter, LVGa – left ventricular geometry alteration, LVMI – left ventricular mass index, LVPW – left ventricular posterior wall, NPA – number of participated athlete, NPC – number of participated competitions, RWT – relative wall thickness, SV – sinus Valsalva size, STJ – sino-tubular junction, TTT – total training time, WTL – weekly training load # Kruskal-Wallis test was applied; variables were given as median (Q1-Q3); *one-way ANOVA was applied; variables are given as mean (SD); ! calculated only for athletic groups; NA – non-available information |
|||||||
|
Table 2. Post-hoc test results following one-way ANOVA/Kruskal-Wallis tests present intergroup differences (p<0.05) |
|||||||
|
Variables |
Overall p |
p (END vs. RES) |
p (END vs. MIX) |
p (RES vs. MIX) |
p-value (END vs. SED) |
p-value (RES vs. SED |
p (MIX vs. SED) |
|
Age# |
0.01 |
1.00 |
0.006 |
0.03 |
1.00 |
1.00 |
0.006 |
|
Weight# |
0.009 |
1.00 |
0.23 |
0.02 |
1.00 |
1.00 |
0.005 |
|
Height# |
0.009 |
0.01 |
0.002 |
1.00 |
0.17 |
0.72 |
0.17 |
|
BSA# |
0.01 |
1.00 |
0.08 |
0.06 |
1.00 |
1.00 |
0.004 |
|
SBP* |
0.005 |
0.25 |
0.99 |
0.39 |
0.71 |
0.001 |
0.3 |
|
DBP# |
0.003 |
0.02 |
1.00 |
0.005 |
1.00 |
0.001 |
1.00 |
|
HR# |
0.008 |
1.00 |
0.01 |
0.002 |
0.52 |
0.28 |
0.15 |
|
TTT# |
<0.001 |
1.00 |
0.9 |
1.00 |
<0.001 |
<0.001 |
<0.001 |
|
WTL# |
<0.001 |
0.01 |
0.5 |
<0.001 |
<0.001 |
<0.001 |
<0.001 |
|
NPC# |
<0.001 |
0.4 |
1.00 |
0.81 |
<0.001 |
<0.001 |
<0.001 |
|
AVA* |
0.01 |
0.99 |
0.13 |
0.01 |
0.99 |
0.68 |
0.24 |
|
SV* |
<0.001 |
0.99 |
0.20 |
0.36 |
0.005 |
0.008 |
0.69 |
|
STJ* |
<0.001 |
0.27 |
0.42 |
1.00 |
<0.001 |
<0.001 |
<0.001 |
|
PAA* |
<0.001 |
0.04 |
0.09 |
1.00 |
<0.001 |
<0.001 |
<0.001 |
|
LA* |
<0.001 |
0.82 |
0.34 |
0.96 |
<0.001 |
<0.001 |
0.007 |
|
LAVI# |
<0.001 |
0.06 |
1.00 |
0.33 |
<0.001 |
0.004 |
<0.001 |
|
IVS# |
<0.001 |
0.29 |
0.04 |
<0.001 |
0.01 |
<0.001 |
1.00 |
|
LVPW* |
<0.001 |
0.38 |
0.06 |
<0.001 |
0.02 |
<0.001 |
1.00 |
|
LVMI* |
<0.001 |
0.87 |
0.06 |
<0.001 |
<0.001 |
<0.001 |
0.31 |
|
RWT# |
<0.001 |
0.003 |
1.00 |
<0.001 |
1.00 |
<0.001 |
1.00 |
|
EDV# |
<0.001 |
1.00 |
0.54 |
0.43 |
<0.001 |
<0.001 |
<0.001 |
|
ESV# |
0.004 |
1.00 |
0.08 |
0.009 |
0.12 |
0.01 |
1.00 |
|
EF# |
<0.001 |
0.38 |
1.00 |
0.04 |
0.01 |
0.53 |
<0.001 |
|
GLS# |
<0.001 |
0.05 |
1.00 |
0.07 |
0.07 |
0.06 |
<0.001 |
|
AVA – aortic valve annulus, BSA – body surface area, DBP – diastolic blood pressure, EDV – end-diastolic volume, ESV – end-systolic volume, GLS – global longitudinal strain, HR – heart rate, IVS – interventricular septum, PAA – proximal ascending aorta, LA – left atrium, LAVI – left atrial volume index, LVMI – left ventricular mass index, LVPW – left ventricular posterior wall, NPA – number of participated athlete, RWT – relative wall thickness, SV – sinus Valsalva size, STJ – sino-tubular junction, TTT – total training time, WTT – weekly training time # Dunn’s test with was selected for post-hoc analysis ; *Sidak test was selected for post-hoc analysis |
|||||||
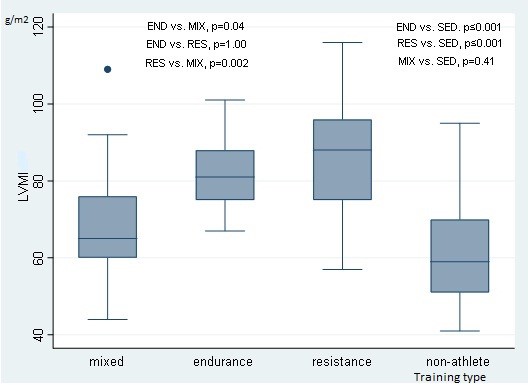
Figure 2. Comparison of LVMI by training type groups revealed significant (p<0.05) differences
LVMI – left ventricular mass index
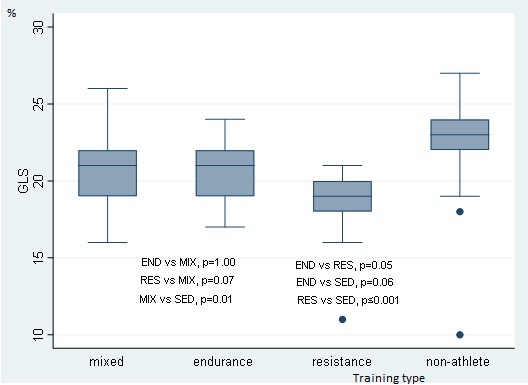
Figure 3. Comparison of GLS by training type groups revealed significant (p<0.05) differences
GLS – global longitudinal strain
Relationship analysis of GLS with other parameters
In Table 3, the results of MLR are highlighted. Age, TTT, WTL, and LVMI were selected for the desired model according to their significant results from simple linear regression. The goodness of fit tests revealed acceptable accuracy, where overall F-test for model p≤0.001, Breusch-Pagan test p=0.12, linktest hat p=0.32, p=0.24. All the included parameters exhibited an inverse relationship with GLS. Albeit the weak values, according to the selected model, WTL was found as an independent predictor with significant p values (unadjusted β=-0.16, adjusted β =-0.12, p=0.01, 95% CI =-0.212 -0.029). Other factors did not show significant associations with GLS (p˃0.05). graphical representation of the relation of GLS with WTL is shown in Figure 3.
|
Table 3. Multiple linear test for the identification of relationships between GLS and other factors |
||||||
|
Variables |
Crude Β value |
Adjusted β value |
SE |
Z/T |
P |
95% CI
|
|
Age |
-0.067 |
-0.041 |
0.151 |
-0.27 |
0.78 |
-0.343 - 0.260 |
|
TTT |
-0.028 |
-0.005 |
0.011 |
-0.46 |
0.64 |
-0.028 - 0.017 |
|
WTL |
-0.162 |
-0.120 |
0.045 |
-2.64 |
0.01 |
-0.212 - -0.029 |
|
LVMI |
-0.065 |
-0.029 |
0.020 |
-1.45 |
0.15 |
-0.069 - 0.010 |
|
LVMI – left ventricular mass index, TTT – total training time, WTL – weekly training load |
||||||
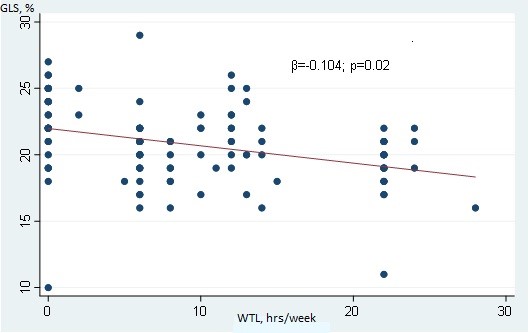
Figure 4. Weak negative inverse significant relationship between WTL and GLS
GLS- global longitudinal strain, WTL – weekly training load
Discussion
Our findings suggest the distinct patterns of cardiac adaptation in END and RES-trained athletes, with MIX-training athletes and SED controls demonstrating nearly normal left heart dimensions. Consistent with previous studies, our results show significantly larger left ventricular (LV) chambers in END athletes, a hallmark adaptation to prolonged volume overload induced by aerobic training (6, 11).
This adaptation is likely due to increased preload, which stimulates chamber dilation to enhance stroke volume and cardiac output, supporting sustained oxygen delivery during prolonged activities. This physiological adaptation aligns with findings in elite END athletes, who frequently exhibit greater LV end-diastolic volume and left atrial enlargement compared to other athlete types and controls (14, 15). While these changes are generally considered benign, ongoing monitoring remains essential to distinguish adaptive from maladaptive remodeling, especially as larger chamber sizes might overlap with cardiomyopathies in imaging assessments (1, 4, 6). Millar et al. (16) reported that stress echocardiography has shown efficacy in the differentiation of dilatational cardiomyopathy from maladaptive athletic heart.
The RES athletes in this study exhibited predominantly hypertrophied LV walls without significant chamber enlargement, a response attributed to the high-pressure load associated with power training. This type of training induces concentric hypertrophy, characterized by increased LV wall thickness and mass while maintaining or even reducing chamber dimensions (1, 6). Moreover, these adaptive changes remained for a long period after deconditioning (17). The hypertrophic response in RES athletes serves as a compensatory mechanism to manage the elevated afterload experienced during resistance exercises. Although this type of hypertrophy is usually physiological, there is a nuanced risk for hypertrophy to become maladaptive, potentially predisposing individuals to the increased risk of sudden cardiac death in cases of predisposing factors (18).
According to studies in literature, football players exhibited overall normal structural indices of left ventricular wall thickness and mass and age-related increase of LVMI (19). In our investigation, the MIX athletes showed larger left heart chamber indices than SED individuals, though their values were smaller compared to those of END and RES athletes. Our findings suggest that while MIX training promotes cardiac adaptation beyond the sedentary baseline, it does not lead to the pronounced myocardial thickening or chamber dilatation seen in RES or END athletes exposed to higher static or dynamic training demands. On the other hand, Balady et al. (20) in their prospective study of American football players—a subset of MIX athletes—reported a significant increase in both LVMI and left heart chamber dimensions. Noteworthy, authors correlated these chamber alterations to the increased SBP (20). However, in our study, no significant difference in SBP was observed between the MIX group and other study groups.
Based on the regression analysis results from our study, no significant relationship was observed between global GLS and LVMI. However, the significant association between WTT and GLS prompted us to assess GLS values across different training modes. Among the training groups, the average GLS values for RES athletes were lower than those of SED individuals and other athletic groups. Additionally, RES athletes demonstrated higher WTL values in contrast to other athletes. These findings suggest that training type, WTL, and the overall volume of the resistance training may influence GLS. In a study by Murray et al. (9), the authors reported no meaningful effect of exercise on GLS. Argan et al. (21) supported this standpoint by finding no significant differences in GLS between wrestlers and SED controls. Conversely, a study involving cyclists found that GLS was influenced by training-related factors, which the authors attributed to long-term, high-load training conditions in athletes (11). Furthermore, the findings of Kandels et al. (22) showed the immediate positive effect of exercise on the cardiac deformation of competitive athletes.
The negative impact of strenuous END exercise on the biventricular cardiac function and the persitence of these values for 24-48 hours were reported by Stewart et al. (23) .The authors explained these effects through altered functional and biochemical mechanisms of myocardium (23). Another study on a cohort of heart failure patients showed the negative effect of electrolyte disturbances on contractile function (24).
In light of the abovementioned reports, our results suggest that the negative relationship between WTL and GLS in wrestlers could be attributed to an imbalance in the adaptation of cardiomyocytes caused by chronic and excessive physical overload. Long-term, high-volume resistance training may lead to chronic impairments, potentially driven by electrolyte disturbances and reduced regenerative factors.
Study limitations
Limitations might involve the cross-sectional design, which limits the ability to track longitudinal changes, and the lack of detailed information on training programs, exact duration and intensity of training sessions, and sportive diet, which could influence cardiac adaptations. Furthermore, the lack of tissue Doppler imaging findings might hinder the potential relationships between other functional cardiac indices and structural cardiac remodeling.
Conclusion
In conclusion, this study underscores the different patterns of cardiac remodeling associated with the type of sportive training. Athletes of endurance training exhibited increased chamber size, while resistance athletes showed increased left ventricular mass. Athletes of resistance training showed lower GLS due to concentric remodeling and high-intensive resistance training weekly load. The GLS is a reliable marker of the athletic heart, reflecting the increased training load and augmented intensity of physical activity in young competitive male athletes. Further prospective studies should be addressed to evaluate effect of GLS and weekly training load on adverse outcomes.
Ethics: The study was approved by the Institutional Review Board (IRB) of the Ala-Too International University by the Declaration of Helsinki. All participants provided informed consent before participating in the study. Data were collected anonymously and stored securely to ensure confidentiality.
Peer-review: External and internal
Conflict of interest: None to declare
Authorship: D.A.A., F. K., A.K.B., A.K. A., K.R.O., S. A.S., Z.K. I., R. B.K, O.A.S., T. Z.K. equally contributed to preparation of the manuscript and fulfilled authorship criteria.
Acknowledgement and funding: None to declare
Statement on A.I.-assisted technologies use: We declare that Chat GPT 4 was used during the manuscript and graphical abstract preparation this manuscript
Availability of data and material: Contact authors of article. In case authors share data, fair use with acknowledgement of authors, data source, citation or collaboration rules apply
References
| 1.Palermi S, Cavarretta E, D'Ascenzi F, Castelleti S, Ricci F, Vecchiato M, et al: Athlete's Heart: A cardiovascular step-by-step multimodality approach. Rev Cardiovasc Med 2023; 24: 151. Doi: 10.31083/j.rcm2405151 https://doi.org/10.31083/j.rcm2405151 |
||||
| 2.Pelliccia A, Sharma S, Gati S, Bäck M, Börjesson M, Caselli S, et al. 2020 ESC guidelines on sports cardiology and exercise in patients with cardiovascular disease: The Task Force on sports cardiology and exercise in patients with cardiovascular disease of the European Society of Cardiology (ESC). Eur Heart J 2021; 42:17-96. doi: 10.1093/eurheartj/ehaa605 https://doi.org/10.1093/eurheartj/ehaa605 |
||||
| 3.Baggish AL, Yared K, Weiner RB, Wang F, Demes R, Picard MH, et al. Differences in cardiac parameters among elite rowers and subelite rowers. Med Sci Sports Exerc 2010; 42: 1215-20. doi: 10.1249/MSS.0b013e3181c81604 https://doi.org/10.1249/MSS.0b013e3181c81604 |
||||
| 4.Brown B, Somauroo J, Green DJ, Wilson M, Drezner J, George K, Oxborough D. The Complex phenotype of the athlete's heart: implications for preparticipation screening. Exerc Sport Sci Rev 2017; 45: 96-104. doi: 10.1249/JES.0000000000000102 https://doi.org/10.1249/JES.0000000000000102 |
||||
| 5.La Gerche A, Wasfy M, Brosnan M, Claessen G, Fatkin D, Heidbuchel H, et al. The Athlete's Heart-Challenges and Controversies: JACC Focus Seminar 4/4. J Am Coll Cardiol 2022: 80: 1346-62. https://doi.org/10.1016/j.jacc.2022.07.014 |
||||
| 6.Martinez MW, Kim JH, Shah AB, Phelan D, Emery MS, Wasfy MM, et al. Exercise-induced cardiovascular adaptations and approach to exercise and cardiovascular disease. JACC State-Of-The-Art Review. J Am Coll Cardiol 2021; 78: 1454-70. doi: 10.1016/j.jacc.2021.08.003 https://doi.org/10.1016/j.jacc.2021.08.003 |
||||
| 7.Carbone A, D'Andrea A, Riegler L, Scarafile R, Pezzullo E, Martone F, et al. Cardiac damage in athlete's heart: When the "supernormal" heart fails! World J Cardiol 2017 ;9: 470- 80. doi: 10.4330/wjc.v9.i6.470 https://doi.org/10.4330/wjc.v9.i6.470 |
||||
| 8.Malhotra A, Sharma S. Hypertrophic cardiomyopathy in athletes. Eur Cardiol 2017; 12: 80-2. doi: 10.15420/ecr.2017:12:1 https://doi.org/10.15420/ecr.2017:12:1 |
||||
| 9.Murray J, Bennett H, Bezak E, Perry R, Boyle T. The effect of exercise on left ventricular global longitudinal strain: a systematic review and meta-analysis. Eur Heart J Cardiovasc Imaging 2022; 23 (Suppl 1): 036. doi: 10.1093/ehjci/jeab289.036 https://doi.org/10.1093/ehjci/jeab289.036 |
||||
| 10.Zholshybek N, Khamitova Z, Toktarbay B, Jumadilova D, Khissamutdinov N, Dautov T, et al. Cardiac imaging in athlete's heart: current status and future prospects. Cardiovasc Ultrasound 2023; 21;¨21. Doi: 10.1186/s12947-023-00319-3 https://doi.org/10.1186/s12947-023-00319-3 |
||||
| 11.Bewarder Y, Lauder L, Kulenthiran S, Schäfer O, Ukena C, Percy Marshall R, et al. Global longitudinal strain differentiates physiological hypertrophy from maladaptive remodeling. Int J Cardiol Heart Vasc 2022; 40: 101044. doi: 10.1016/j.ijcha.2022.101044 https://doi.org/10.1016/j.ijcha.2022.101044 |
||||
| 12.Lang RM, Badano LP, Mor-Avi V, Afilalo J, Armstrong A, Ernando L, et al. Echocardiography and the European Association of, Cardiovascular Imaging. Eur Heart J Cardiovasc Imaging 2016; 17: 412. doi: 10.1093/ehjci/jew041 https://doi.org/10.1093/ehjci/jew041 |
||||
| 13.Nyberg J, Jakobsen EO, Østvik A, Holte E, Stølen S, Lovstakken L, et al. Echocardiographic reference ranges of global longitudinal strain for all cardiac chambers using guideline-directed dedicated views. JACC Cardiovasc Imaging. 2023; 16: 1516-31. doi: 10.1016/j.jcmg.2023.08.011. https://doi.org/10.1016/j.jcmg.2023.08.011 |
||||
| 14.Wasfy MM, Weiner RB, Wang F, Berkstresser B, Deluca J, Hutter AM Jr, et al.. Myocardial adaptations to competitive swim training. Med Sci Sports Exerc 2019; 51: 1987-94. doi: 10.1249/MSS.0000000000002022 https://doi.org/10.1249/MSS.0000000000002022 |
||||
| 15.Cuspidi C, Tadic M, Sala C, Gherbesi E, Grassi G, Mancia G. Left atrial function in elite athletes: A meta-analysis of two-dimensional speckle tracking echocardiographic studies. Clin Cardiol 2019 https://doi.org/10.1002/clc.23180 |
||||
| 42: 579-87. doi: 10.1002/clc.23180. Epub 2019 Apr 9. https://doi.org/10.1002/clc.23180 |
||||
| 16.Millar LM, Fanton Z, Finocchiaro G, Sanchez-Fernandez G, Dhutia H, Malhotra A, et al. Differentiation between athlete's heart and dilated cardiomyopathy in athletic individuals. Heart 2020l; 106: 1059-65. doi: 10.1136/heartjnl-2019-316147 https://doi.org/10.1136/heartjnl-2019-316147 |
||||
| 17.Demirelli S, Sam CT, Ermis E, Degirmenci H, Sen I, Arisoy A, et al. Long-Term cardiac remodeling in elite athletes: assessment by tissue doppler and speckle tracking echocardiography. Echocardiogr 2015; 32: 1367-73. doi: 10.1111/echo.12860 https://doi.org/10.1111/echo.12860 |
||||
| 18. Maron BJ, Doerer JJ, Haas TS, Tierney DM, Mueller FO. Sudden deaths in young competitive athletes: analysis of 1866 deaths in the United States, 1980-2006. Circulation 2009; 119: 1085-92. doi: 10.1161/CIRCULATIONAHA.108.804617 https://doi.org/10.1161/CIRCULATIONAHA.108.804617 |
||||
| 19.Churchill TW, Petek BJ, Wasfy MM, Guseh JS, Weiner RB, Singh TK, et al. Cardiac structure and function in elite female and male soccer players. JAMA Cardiol 2021; 6: 316-25. doi: 10.1001/jamacardio.2020.6088 https://doi.org/10.1001/jamacardio.2020.6088 |
||||
| 20.Balady GJ, Drezner JA. Tackling cardiovascular health risks in college football players. Circulation 2013; 128: 477-80. doi: 10.1161/CIRCULATIONAHA.113.004039 https://doi.org/10.1161/CIRCULATIONAHA.113.004039 |
||||
| 21.Argan O, Bozyel S, Akay K, Avci E, Kiris T. Assessment of left ventricular myocardial function in wrestlers: A focus on speckle tracking echocardiography. Balikesir Saglik Bil Derg 2022; 11: 248-54. doi:10.53424/balikesirsbd.1028121 https://doi.org/10.53424/balikesirsbd.1028121 |
||||
| 22.Kandels J, Stöbe S, Kogel A, Hepp P, Riepenhof H, Droste JN, et al. Effect of maximum exercise on left ventricular deformation and its correlation with cardiopulmonary exercise capacity in competitive athletes. Echo Res Pract 2023; 10: 17. doi: 10.1186/s44156-023-00029-6 https://doi.org/10.1186/s44156-023-00029-6 |
||||
| 23.Stewart GM, Yamada A, Haseler LJ, Kavanagh JJ, Chan J, Koerbin G, et al. Influence of exercise intensity and duration on functional and biochemical perturbations in the human heart. J Physiol 2016; 594: 3031-44. https://doi.org/10.1113/JP271889 |
||||
| 24.Gupta H, Sahani KK, Singh MM, Seth G, Gupta A. Impact of dyseletrolitemia on heart failure and their long-term cardiovascular outcomes: A comparative analysis. Adv Clin Med Res 2024; 5: 1-10. https://doi.org/10.52793/ACMR.2024.5(3)-83 |
||||
Copyright

This work is licensed under a Creative Commons Attribution-NonCommercial 4.0 International License.
AUTHOR'S CORNER